Break-up of Consolidated Revenue as per Geography
FY24 (In ₹ mn)
Break-up of Consolidated Revenue as per Business Segment
FY 24 (In ₹ mn)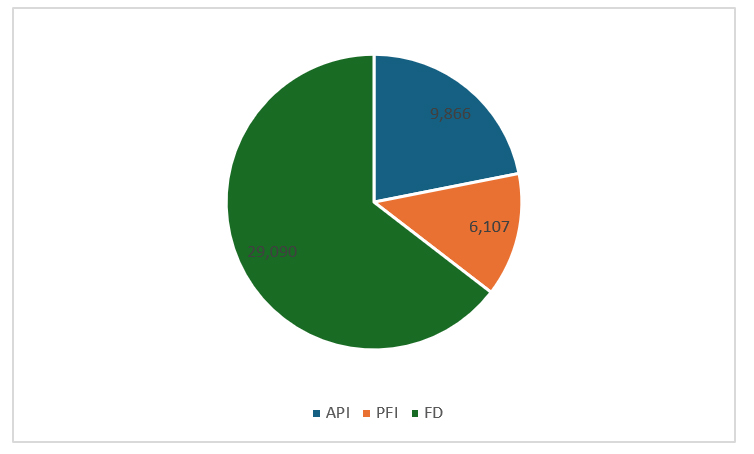
Break-up of Consolidated Revenue as per Business Segment
FY'20 (Rs. in Mn)13,602
52%8,170
31%4,214
16%
API
PFI
FD